Scenario comparison
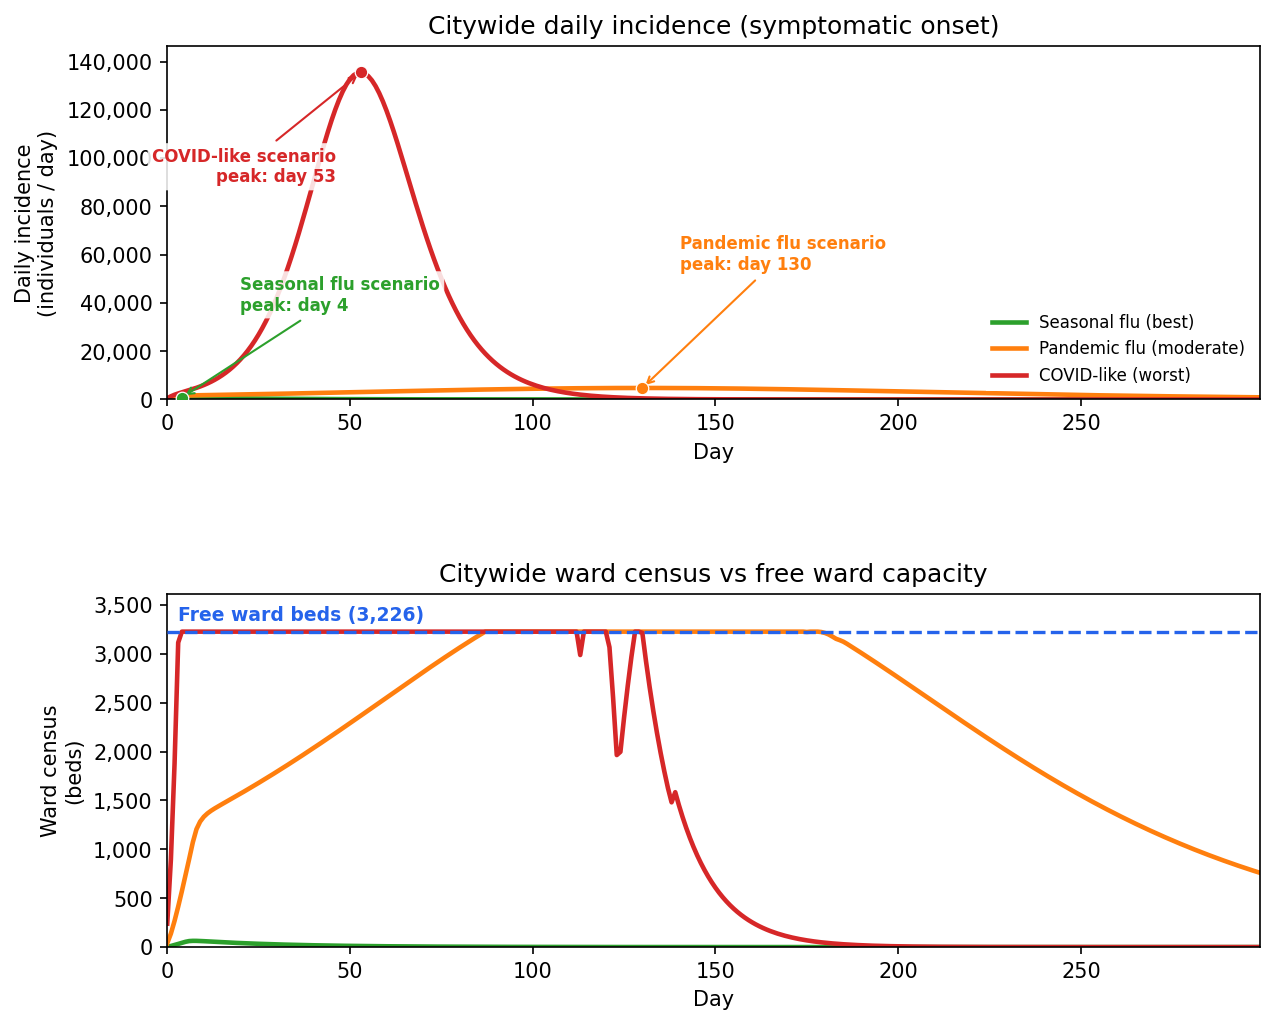
Fixed illustrative runs under three transmission scenarios: citywide epidemic scale, ward-bed pressure, then which hospital systems and ZIPs are most stressed.
These tables use the fixed scenario parameter sets below. To test other parameter sets and see how citywide stress changes, open the Shiny app.
Model assumptions (fixed scenario parameters)
Mid values from the project parameter registry. Shared occupancy and hospital-routing rules apply to all three scenarios.
| Parameter | Seasonal flu (best) | Pandemic flu (moderate) | COVID-like (worst) |
|---|---|---|---|
| R₀ | 1.25 | 1.5 | 3 |
| P(symptomatic | infection) | 25% | 50% | 70% |
| Hospitalization | case | 1.4% | 10% | 50% |
| ICU | hospitalization | 17% | 20% | 30% |
| LOS ward (days) | 6 | 7.5 | 9.5 |
| LOS ICU (days) | 7 | 8.5 | 11 |
| CFR (symptomatic) | 0.1% | 0.1% | 3% |
Citywide incidence and ward demand
Hospital systems (by assigned ZIP cases)
Hospital systems with the most cases among ZIP codes assigned to their hospitals.
| Top hospital system | Seasonal flu (best) | Pandemic flu (moderate) | COVID-like (worst) | |||
|---|---|---|---|---|---|---|
| System | Cases | System | Cases | System | Cases | |
| #1 | NYC H+H | 5,589 | NYC H+H | 219,252 | NYC H+H | 1,274,374 |
| #2 | INDEPENDENT | 2,904 | INDEPENDENT | 113,907 | INDEPENDENT | 662,069 |
| #3 | NEW YORK - PRESBYTERIAN | 2,657 | NEW YORK - PRESBYTERIAN | 104,230 | NEW YORK - PRESBYTERIAN | 605,823 |
Hospital systems (by ward admissions, including overflow)
Hospital systems with the most ward admissions after redirecting overflow from full hospitals.
| Top hospital system | Seasonal flu (best) | Pandemic flu (moderate) | COVID-like (worst) | |||
|---|---|---|---|---|---|---|
| System | Ward admits | System | Ward admits | System | Ward admits | |
| #1 | NYC H+H | 78 | NYC H+H | 22,358 | NYC H+H | 10,812 |
| #2 | INDEPENDENT | 40 | NEW YORK - PRESBYTERIAN | 14,616 | NEW YORK - PRESBYTERIAN | 7,963 |
| #3 | NEW YORK - PRESBYTERIAN | 37 | MOUNT SINAI HEALTH SYSTEM | 9,451 | MOUNT SINAI HEALTH SYSTEM | 5,087 |
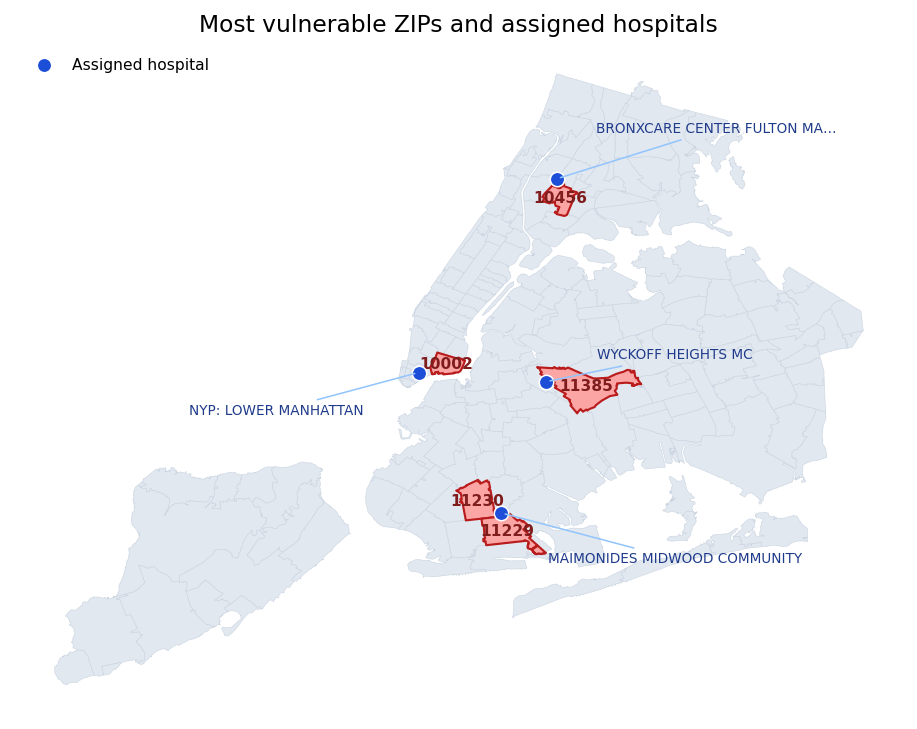
Most vulnerable (high cases / low free acute beds) ZIPs
Rank order, ZIP, free beds, and assigned hospital are the same across scenarios. Cases and ratios scale with each scenario.
| # | ZIP | Free acute beds | Assigned hospital | Seasonal flu (best) | Pandemic flu (moderate) | COVID-like (worst) | |||
|---|---|---|---|---|---|---|---|---|---|
| Cases | Ratio | Cases | Ratio | Cases | Ratio | ||||
| #1 | 10456 | 29 | BRONXCARE CENTER FULTON MANDY (1164) | 316 | 10.9 | 12,379 | 428.3 | 71,953 | 2,489.7 |
| #2 | 11229 | 24 | MAIMONIDES MIDWOOD COMMUNITY (1293) | 223 | 9.2 | 8,755 | 361.8 | 50,886 | 2,102.7 |
| #3 | 11230 | 24 | MAIMONIDES MIDWOOD COMMUNITY (1293) | 209 | 8.6 | 8,210 | 339.2 | 47,718 | 1,971.8 |
| #4 | 10002 | 30 | NYP: LOWER MANHATTAN (1437) | 251 | 8.5 | 9,864 | 332.1 | 57,334 | 1,930.4 |
| #5 | 11385 | 34 | WYCKOFF HEIGHTS MC (1318) | 260 | 7.7 | 10,181 | 300.3 | 59,179 | 1,745.7 |
Vulnerability ratio = cumulative ZIP cases ÷ free acute beds at the assigned hospital. Free acute beds = staffed beds × (1 − ward occupancy). Illustrative analyses — not clinical guidance.